Blog / Race Data
Average Marathon Time by Age and Gender: 2026 Data
Complete finish time statistics with percentile rankings, Boston Qualifying comparisons, and the definitive answer to "Am I fast for my age?"
The Direct Answer
The overall average marathon finish time is 4:32:49 for men and 4:58:33 for women across all adult age groups. The most common finish window (accounting for ~40% of all finishers) is between 4:00 and 5:00.
Peak marathon performance occurs at ages 25-34. After 35, average finish times increase roughly 10-20 minutes per decade. Any time under 4:00 for men or 4:30 for women places you in the top 25% of your age group.
4:32:49
Men's Overall Average
4:58:33
Women's Overall Average
35-39
Peak Participation Age Group
0.5%
of Americans Are Marathoners
Average Marathon Finish Times by Age Group and Gender
These averages are derived from aggregate U.S. marathon finish data. They represent the median finisher in each age group: half of all runners in that group finish faster, half finish slower.
| Age Group | Men Average | Men Pace/Mi | Women Average | Women Pace/Mi |
|---|---|---|---|---|
| 18–24 | 4:15:30 | 9:45/mi | 4:42:14 | 10:46/mi |
| 25–29 | 4:17:47 | 9:50/mi | 4:44:07 | 10:51/mi |
| 30–34 | 4:21:49 | 10:00/mi | 4:48:26 | 11:01/mi |
| 35–39 | 4:29:18 | 10:17/mi | 4:57:11 | 11:22/mi |
| 40–44 | 4:34:03 | 10:28/mi | 5:03:52 | 11:37/mi |
| 45–49 | 4:42:42 | 10:48/mi | 5:15:44 | 12:04/mi |
| 50–54 | 4:55:04 | 11:16/mi | 5:30:08 | 12:37/mi |
| 55–59 | 5:11:57 | 11:55/mi | 5:49:15 | 13:21/mi |
| 60–64 | 5:34:46 | 12:47/mi | 6:13:22 | 14:16/mi |
| 65–69 | 5:59:01 | 13:43/mi | 6:42:32 | 15:22/mi |
| 70+ | 6:32:22 | 14:59/mi | 7:26:11 | 17:02/mi |
Source: Aggregate analysis of U.S. marathon finish data including Chicago, NYC, Boston, LA, and Houston marathons plus RunRepeat global finish statistics. Times represent median finisher in each age/gender category.
Gear for a faster marathon
Pacing a marathon well takes accurate distance and pace data. These watches add race predictors and training load so you know whether the goal time above is realistic.
As an Amazon Associate we earn from qualifying purchases. Prices are approximate and change often. Picks are researched from manufacturer specs and owner reviews, not hands-on testing, and this is general information, not professional advice.
Am I Fast for My Age? Marathon Percentile Rankings
The tables below show finish time percentiles for the two most populated age groups. To find where your finish time falls, locate your time in the relevant column. Running faster than the 50th percentile means you finished faster than half of all runners in your age group.
Men's Marathon Percentile Rankings by Age Group
| Percentile | 18–29 | 30–39 | 40–49 | 50–59 | 60–69 |
|---|---|---|---|---|---|
| Top 10% | 3:10:00 | 3:22:00 | 3:31:00 | 3:52:00 | 4:20:00 |
| Top 25% | 3:38:00 | 3:48:00 | 3:58:00 | 4:18:00 | 4:52:00 |
| Median (50%) | 4:16:00 | 4:25:00 | 4:38:00 | 5:02:00 | 5:46:00 |
| Bottom 25% | 5:04:00 | 5:12:00 | 5:26:00 | 5:58:00 | 6:44:00 |
Women's Marathon Percentile Rankings by Age Group
4:43:00 is the median marathon finish for women aged 18 to 29, and this chart ranks times by percentile across every age group shown.
| Percentile | 18–29 | 30–39 | 40–49 | 50–59 | 60–69 |
|---|---|---|---|---|---|
| Top 10% | 3:38:00 | 3:50:00 | 4:02:00 | 4:26:00 | 5:02:00 |
| Top 25% | 4:08:00 | 4:19:00 | 4:33:00 | 5:02:00 | 5:40:00 |
| Median (50%) | 4:43:00 | 4:52:00 | 5:09:00 | 5:39:00 | 6:27:00 |
| Bottom 25% | 5:34:00 | 5:48:00 | 6:04:00 | 6:36:00 | 7:24:00 |
Boston Marathon Qualifying Times vs. Average Finish Times
The Boston Marathon sets qualifying standards by age group and gender. These BQ times represent approximately the top 5-8% of all marathon finishers in each age group. For everyday training paces rather than race finishes, see our average running pace by age and gender chart. In recent years, even qualifying has not guaranteed entry: runners typically need to beat the BQ standard by 5-10 minutes to receive an acceptance.
| Age Group | Men BQ Standard | Men Avg Finish | Women BQ Standard | Women Avg Finish | Gap (M) |
|---|---|---|---|---|---|
| 18–34 | 2:55:00 | 4:17:47 | 3:25:00 | 4:43:00 | +1:22:47 |
| 35–39 | 3:00:00 | 4:29:18 | 3:30:00 | 4:57:11 | +1:29:18 |
| 40–44 | 3:05:00 | 4:34:03 | 3:35:00 | 5:03:52 | +1:29:03 |
| 45–49 | 3:15:00 | 4:42:42 | 3:45:00 | 5:15:44 | +1:27:42 |
| 50–54 | 3:20:00 | 4:55:04 | 3:50:00 | 5:30:08 | +1:35:04 |
| 55–59 | 3:30:00 | 5:11:57 | 4:00:00 | 5:49:15 | +1:41:57 |
| 60–64 | 3:50:00 | 5:34:46 | 4:20:00 | 6:13:22 | +1:44:46 |
| 65–69 | 4:05:00 | 5:59:01 | 4:35:00 | 6:42:32 | +1:54:01 |
| 70–74 | 4:20:00 | 6:18:00 | 4:50:00 | 7:10:00 | +1:58:00 |
Important note on Boston entry
Meeting the qualifying standard does not guarantee entry. In recent years, the BAA has required runners to beat the standard by an additional 5-10 minutes due to oversubscription. Use our Race Time Predictor to target your needed pace.
What Do Common Marathon Benchmark Times Mean?
A sub-3:00 marathon needs 6:52/mi and puts a man in the top 3%, and the table explains what each benchmark finish time represents.
| Finish Time | Required Pace | Men: Approx Percentile (All Ages) | What It Represents |
|---|---|---|---|
| Sub-2:30 | 5:43/mi | Top 0.3% | Elite / national class |
| Sub-3:00 | 6:52/mi | Top 3% | Boston qualifier (most ages) |
| Sub-3:30 | 8:01/mi | Top 12% | Highly competitive recreational |
| Sub-4:00 | 9:09/mi | Top 28% | Above-average recreational |
| Sub-4:30 | 10:18/mi | Top 45% | Near average / solid runner |
| Sub-5:00 | 11:27/mi | Top 60% | Average recreational marathon |
| Sub-6:00 | 13:44/mi | Top 80% | Run/walk finisher |
Frequently Asked Questions
What is the average marathon time?
The overall average marathon finish time is 4:32:49 for men and 4:58:33 for women. These figures span all adult age groups. The most common finish bracket: 4:00 to 5:00: accounts for approximately 40% of all finishers at major U.S. marathons.
What is a good marathon time for a beginner?
For a first-time marathoner, finishing under 5:00:00 is a solid goal. The average first-time finish is approximately 4:44 for men and 5:08 for women. Any finish is an accomplishment: completing 26.2 miles puts you in the top 0.5% of the U.S. population that has ever run a marathon.
What are the Boston Marathon qualifying times?
Boston qualifying times for 2026 and 2027 range from 2:55:00 (men 18-34) to 4:50:00 (men 80+). Women receive an additional 30 minutes per age group. However, qualifying does not guarantee entry, in recent cycles, runners needed to beat the standard by 5-10 minutes to be accepted due to high demand.
Am I fast for my age in a marathon?
If your time is faster than the median listed in the main table for your age group, you finished faster than at least half of all runners in your category, which makes you above average. The top 10% threshold for men ages 40-44 is approximately 3:31; for women in the same group, it is 4:02.
How much slower does marathon performance get with age?
Marathon times slow roughly 10-20 minutes per decade between ages 30-50, and 20-30 minutes per decade after 50. The overall decline is approximately 1-2% per year. Well-trained runners who maintain consistent mileage and incorporate speed work experience a slower decline of 0.5-1% per year.
Related Marathon Tools and Guides
Featured at Backcountry: 15% off first order
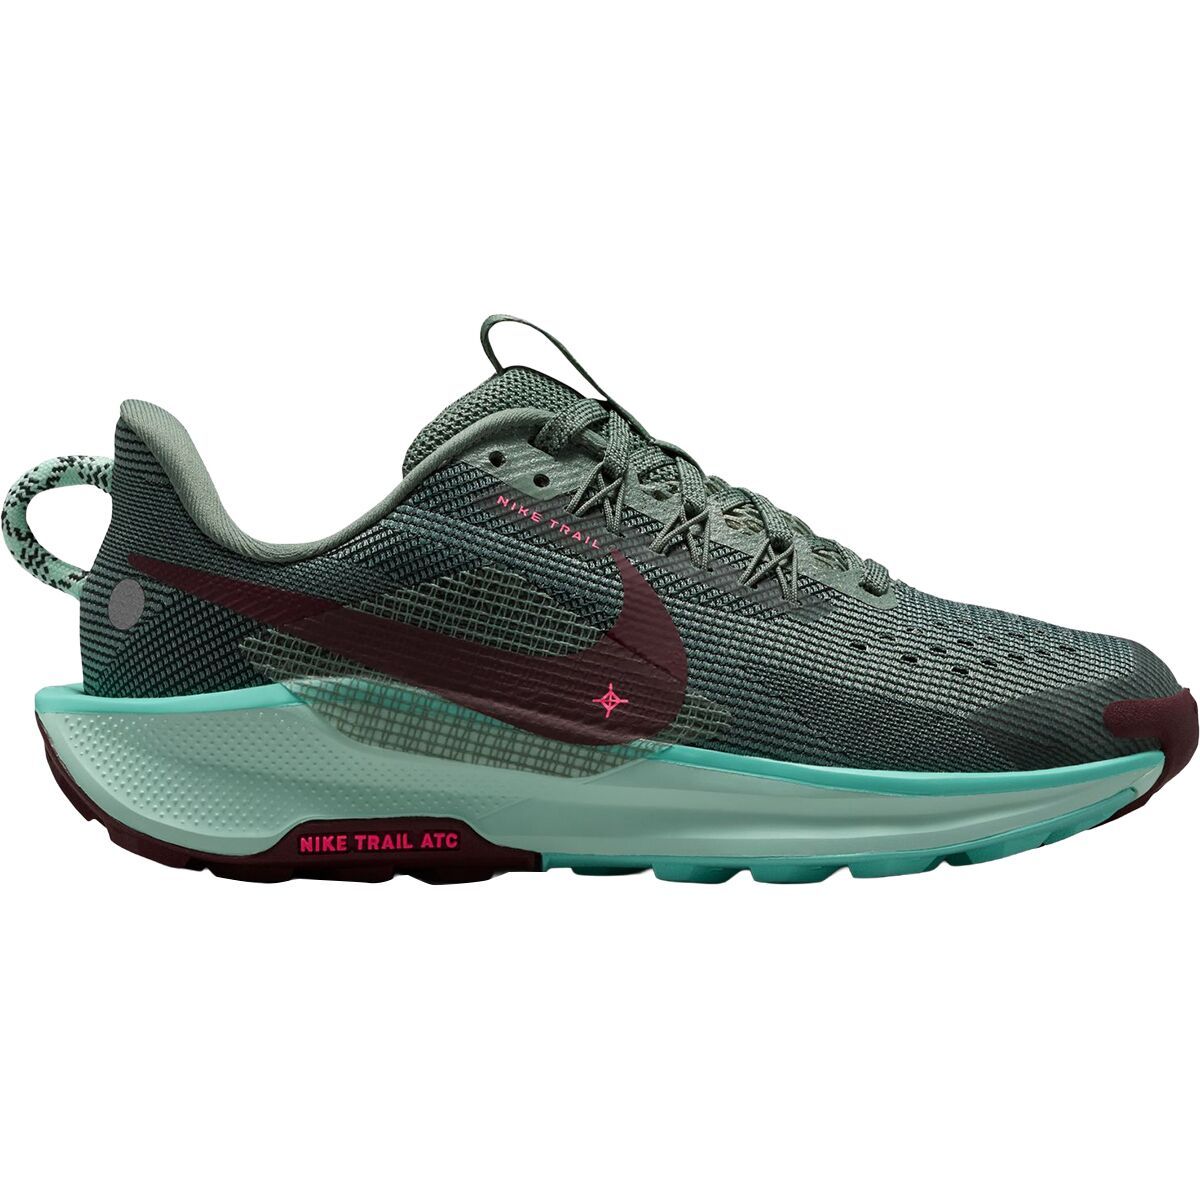
Nike Pegasus Trail 5
A popular trail-capable training shoe. React foam + sticky outsole.
More questions answered
What percentage of people finish a marathon?
Approximately 0.5% of the U.S. population has ever finished a marathon. Of those who start a marathon, roughly 98-99% finish. The primary reasons for DNF (Did Not Finish) are injury, cramping, and exceeding the race's time cutoff, which is typically 6-7 hours at most large marathons.
What is the average marathon pace per mile?
The average marathon pace across all finishers is approximately 10:22 per mile for men (4:32:49 finish) and 11:23 per mile for women (4:58:33 finish). To run a 4:00 marathon you need to maintain exactly 9:09 per mile. A 3:30 marathon requires 8:01 per mile. A 3:00 marathon (Boston qualifying for most ages) requires 6:52 per mile.
How much slower do marathoners get with age?
Marathon performance declines approximately 1-2% per year after age 35. Between ages 35 and 50, runners typically slow about 15-20 minutes per decade. After 50, the decline is steeper, roughly 20-30 minutes per decade. Well-trained masters runners who maintain high mileage and include speed work see a slower decline of approximately 0.5-1% per year.